Tell us about the job
Takes about a minute. No obligation.
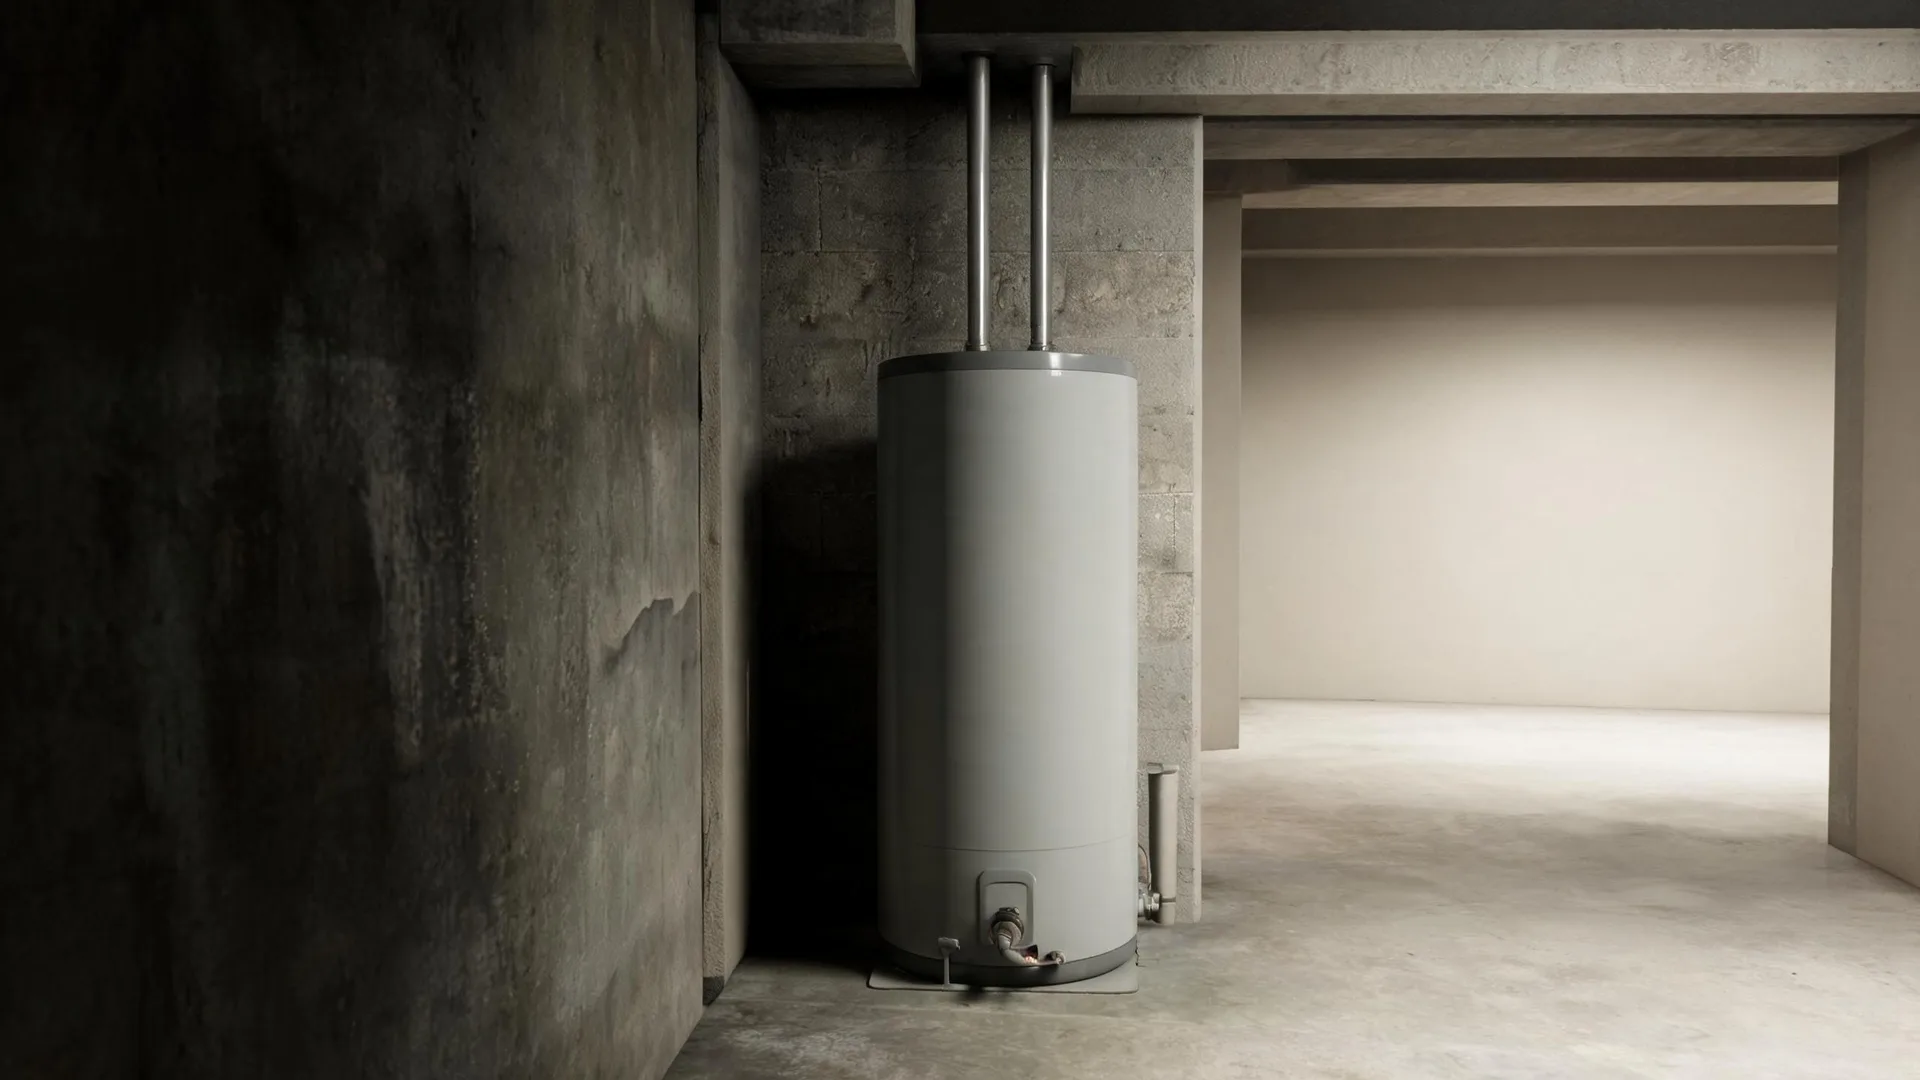
Gas-fueled water heaters call for specific venting and combustion air arrangements, and what a contractor finds inside the utility room determines what the replacement can be. Utility gas heats more occupied homes in Humboldt County, California than any other fuel, at 55.5% (2020-2024 ACS 5-year). That share means the existing infrastructure in most homes here was designed around gas combustion: flue type, draft hood clearance, and the air supply the burner draws on. A contractor quoting a replacement checks those conditions first, because a new unit installed into a vent run sized for a different appliance fails inspection and can fail safely.
Older wiring and service panels are the variable that most often changes the price and scope of a water heater install in this county. Half the homes in Humboldt County, California were built in 1973 or earlier (2020-2024 ACS 5-year). Houses built in that period were wired for lighter loads, and a standard electric water heater draws more current than many of those original panels were designed to handle. A contractor working in stock like this checks the service capacity before settling on equipment, because the panel upgrade, if one is needed, sets the terms for everything else.
What a Water Heater Installation Covers
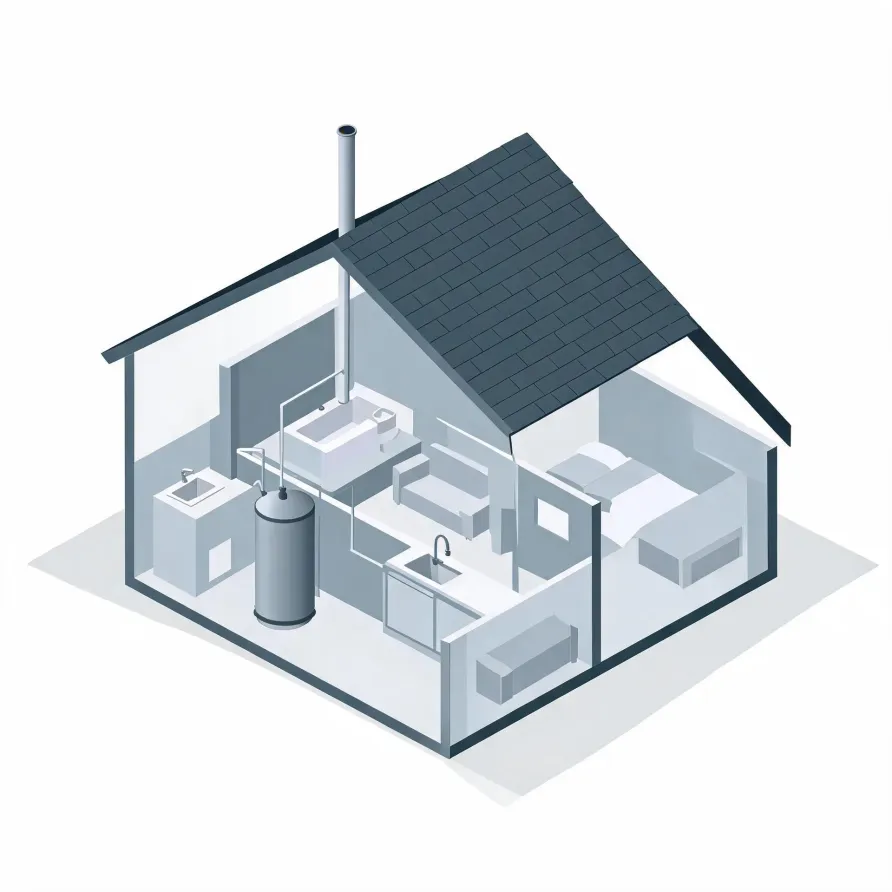
The tank or tankless unit is the heart of the system. A storage tank sits in a utility closet, garage, or basement and holds a ready supply of hot water. A tankless unit mounts to a wall and heats water on demand as it passes through.
Connected to the unit are the cold-water supply line feeding it and the hot-water line running to every fixture in the house. A pressure relief valve mounts directly on the unit as a safety device, and a drain pan sits beneath it to catch any discharge.
The drawing shows a general layout of these components, and a licensed contractor determines what the installation requires in your specific home.
Get matched in Humboldt CountyHumboldt County, by the numbers
282 severe weather events were recorded in Humboldt County, California between 2015 and 2024.
NOAA National Centers for Environmental Information, Storm Events Database, bulk CSV export, events 2015-01-01 through 2024-12-31.Half the homes in Humboldt County, California were built in 1973 or earlier (2020-2024 ACS 5-year).
U.S. Census Bureau, 2020-2024 American Community Survey 5-Year EstimatesHumboldt County, California holds 62,883 housing units (2020-2024 ACS 5-year).
U.S. Census Bureau, 2020-2024 American Community Survey 5-Year EstimatesOwners occupy 56.5% of the occupied homes in Humboldt County, California (2020-2024 ACS 5-year).
U.S. Census Bureau, 2020-2024 American Community Survey 5-Year EstimatesWater Heater Installation Rules on the Books for Humboldt County, California1 codes & standards
Licensing Rules for HVAC Work in Humboldt County, California
California requires a state contractor license: it is a misdemeanour to engage in the business of, or act in the capacity of, a contractor in California without one, unless the work is exempt.
Weather Events in Humboldt County
Extreme weather puts real demands on water heating equipment, shortening service life and raising the stakes on installation decisions. What holds true in one part of California does not always hold true here, which is why local conditions belong in this conversation.
282 severe weather events, 2015–2024. Source: NOAA National Centers for Environmental Information, Storm Events Database.