Tell us about the job
Takes about a minute. No obligation.
A contractor quoting a water heater replacement in Yolo County starts by confirming what the house burns and how it exhausts combustion gases, because those two facts set the boundaries of every decision that follows. Utility gas heats more occupied homes in Yolo County, California than any other fuel, at 59.6% (2020-2024 ACS 5-year). Gas water heaters draw combustion air and vent exhaust, and an older flue shared with a furnace changes what a new high-efficiency unit is allowed to do with that same stack. The gas line itself has to carry the demand. A contractor checks the pipe size and the meter rating before settling on a unit, because a mismatch there will starve the burner and shorten the heat exchanger's life regardless of how well the rest of the install goes.
Older electrical panels sized for lighter loads are where water heater installations in Yolo County run into trouble. Half the homes in Yolo County, California were built in 1983 or earlier (2020-2024 ACS 5-year). A water heater installed today draws more from a service panel than what that panel was originally designed to handle, and a contractor pricing the job has to open the electrical box before the unit is ever ordered. If the panel cannot carry the new load, upgrading it changes the scope of the job before the heater itself is even on the floor.
What a Water Heater Installation Covers
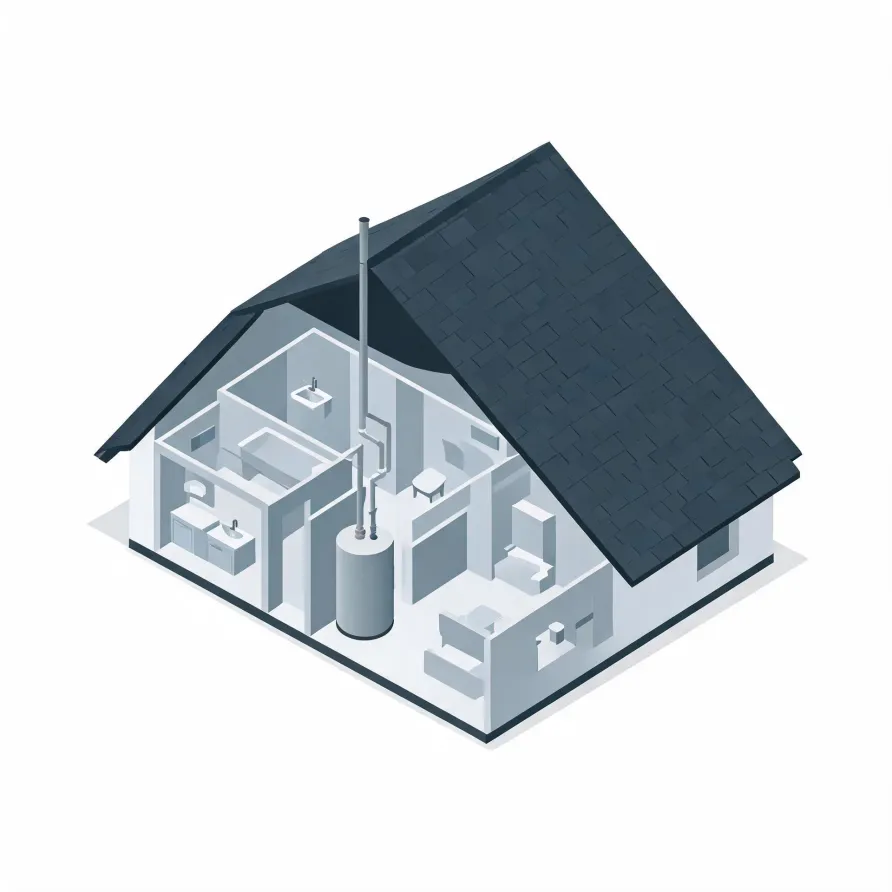
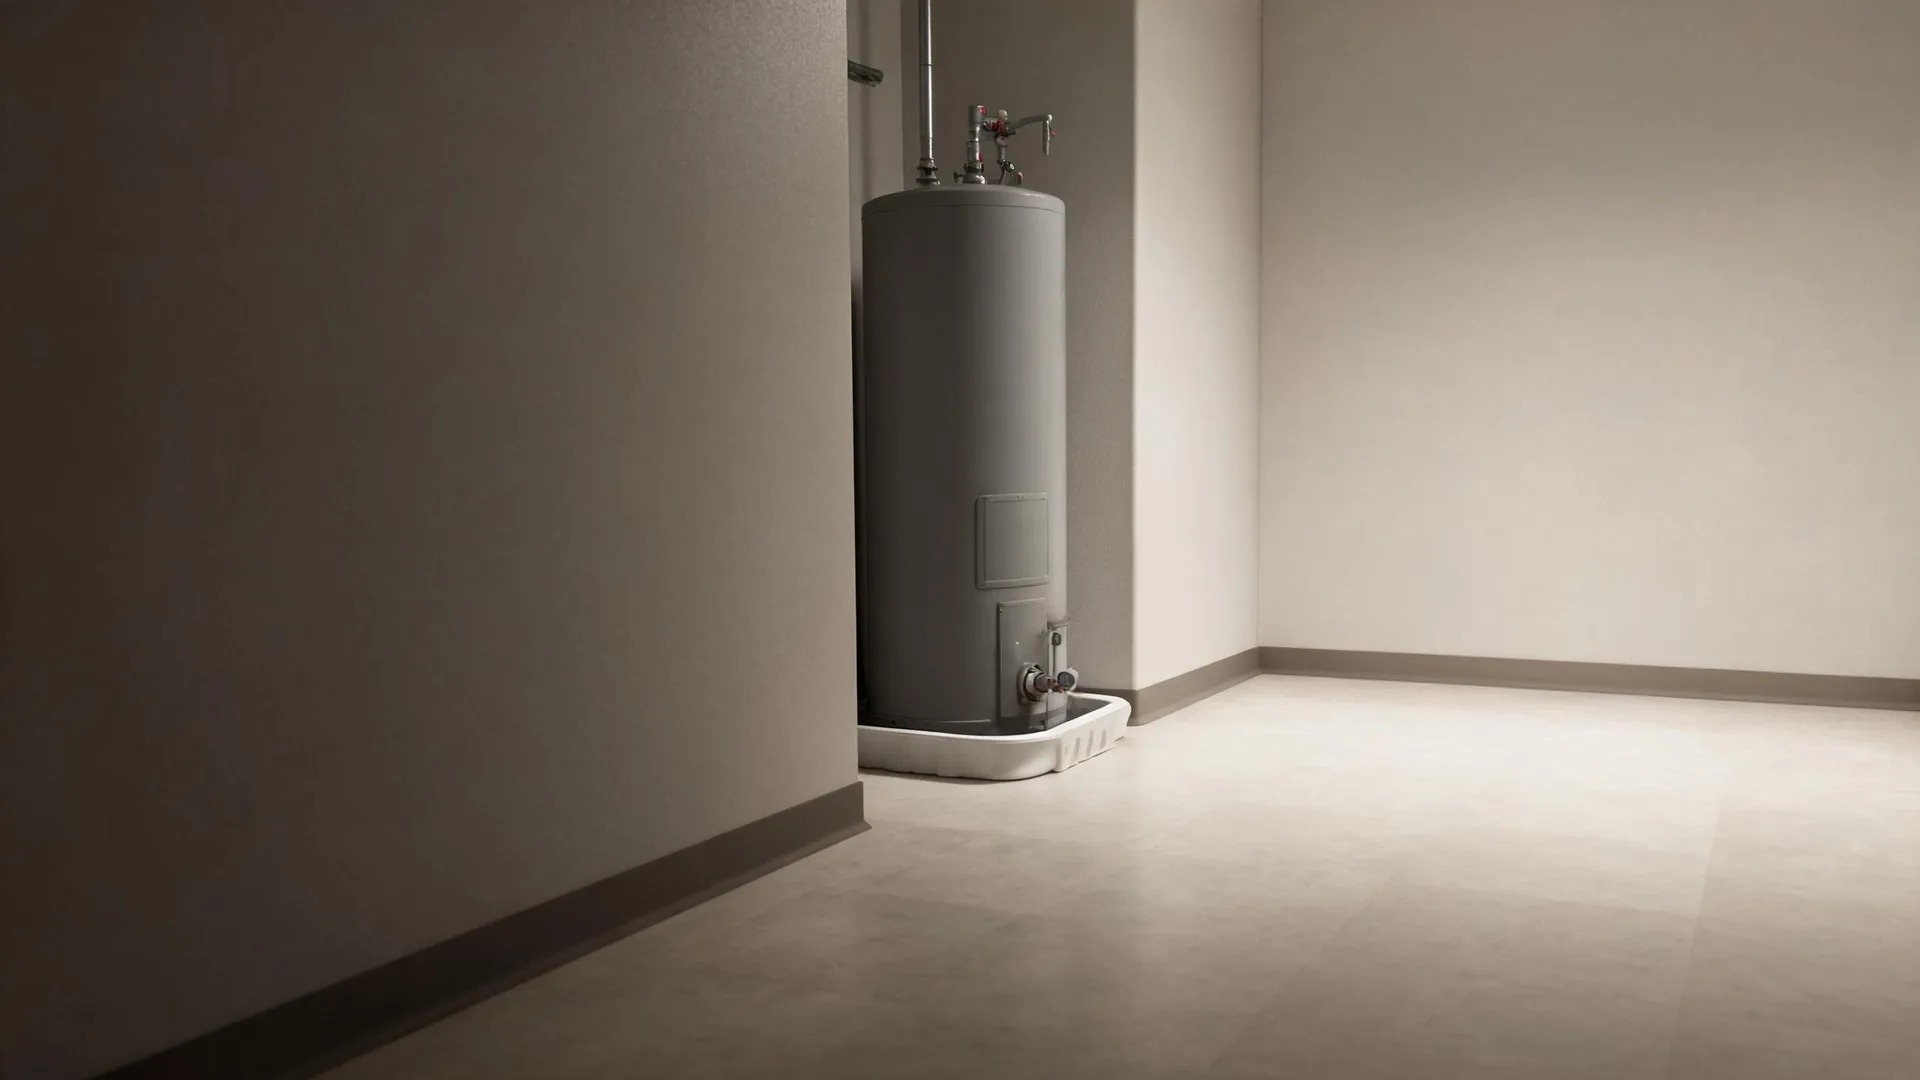
The tank or tankless unit is the centerpiece of the system. A storage tank unit sits in a utility closet, garage, or basement and holds a ready supply of hot water. A tankless unit mounts to a wall and heats water on demand as it passes through the unit.
A pressure relief valve mounts directly on the tank as a safety device, and a drain valve sits near the base for servicing. Cold water supply lines feed into the unit and hot water lines carry the output to every fixture in the house. A dedicated gas line or electrical circuit connects to the unit depending on its fuel type.
The drawing shows a general layout of these components, and a licensed contractor determines what the installation requires in your specific home.
Find a contractor in Yolo CountyYolo County, by the numbers
49 severe weather events were recorded in Yolo County, California between 2015 and 2024.
NOAA National Centers for Environmental Information, Storm Events Database, bulk CSV export, events 2015-01-01 through 2024-12-31.Half the homes in Yolo County, California were built in 1983 or earlier (2020-2024 ACS 5-year).
U.S. Census Bureau, 2020-2024 American Community Survey 5-Year EstimatesYolo County, California holds 82,447 housing units (2020-2024 ACS 5-year).
U.S. Census Bureau, 2020-2024 American Community Survey 5-Year EstimatesOwners occupy 54.3% of the occupied homes in Yolo County, California (2020-2024 ACS 5-year).
U.S. Census Bureau, 2020-2024 American Community Survey 5-Year EstimatesSevere Weather Events in Yolo County
Weather puts a measurable load on water heating equipment, and that load varies by where you live. How hard local conditions push a system shapes what a contractor installs and how that equipment holds up over time.
49 severe weather events, 2016–2024. Source: NOAA National Centers for Environmental Information, Storm Events Database.